homesolutionsContent hubblogcontact
Climate Changes

The Palisades Fire’s Footprint

Ronaldo Menezes
Jan 27, 2025
HomeBlogClimate Changes
Post

The Palisades fire ignited around 10:30 a.m. on January 7, 2025, near the Pacific Palisades neighborhood of Los Angeles, California. By midday the next day, the fire had grown to over 11,000 acres (44 square kilometers), and after one week, it had consumed nearly 24,000 acres (97 square kilometers) of wildland and developed areas.

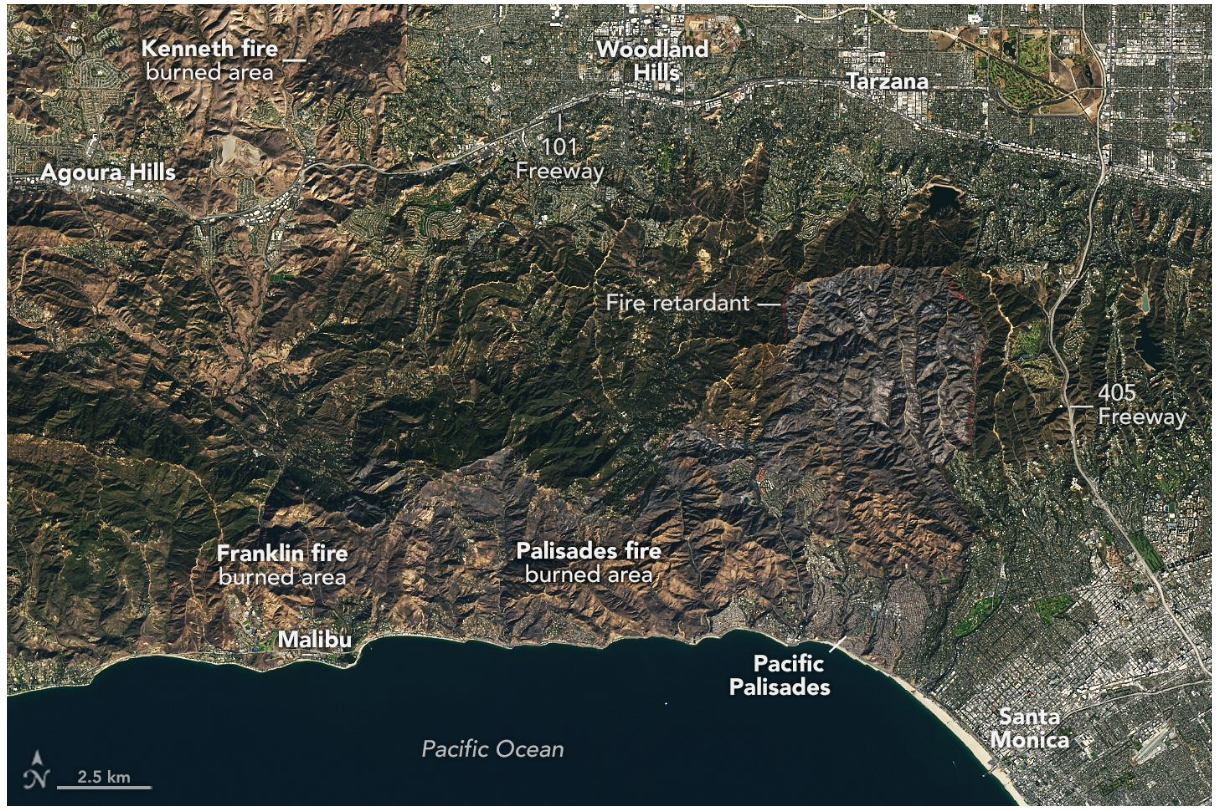
The images above, acquired on January 14 by the OLI-2 (Operational Land Imager-2) on Landsat 9, show the area affected by the fire. In the natural color image (left), visibly charred areas stretch to the north and west of Pacific Palisades. Several lines of bright red or pink fire retardant dropped by aircraft appear along the perimeter of the burned area. (These are more visible in the larger image.)

The false-color image (right) combines shortwave infrared, near infrared, and visible components (OLI bands 6-5-3) of the electromagnetic spectrum. This band combination makes it easier to identify unburned vegetation (green) and recently burned landscape (light to dark brown).

The 1,052 acres (4 square kilometers) burned by the Kenneth fire, which was active January 9–12, appears at the top of both images. This brush fire prompted mandatory evacuation orders, but no structures were damaged by the blaze, according to news reports. Near the coast and adjacent to the Palisades fire’s burned area, land previously charred by the December 2024 Franklin fire remains visible in and around Malibu.

‍

These false-color images provide a more detailed look at the landscape before and after the Palisades fire’s rapid growth. An image acquired on January 6 by the OLI on Landsat 8 (left) shows the older burned area around Malibu, while areas east remained mostly vegetated with several patches of bare ground. Comparing that image with the one acquired on January 14 (right) helps reveal the Palisades fire’s footprint, not only in the more vegetated wildland areas but also in developed zones.

On January 14, the Palisades fire was still considered active, and Cal Fire reported it was 18 percent contained. While the department had not indicated any growth in the fire’s area since January 12, it cautioned that the potential was still there. A red flag warning was in effect through the evening of January 15.

NASA’s Disasters Response Coordination System has been activated to support agencies responding to the fires, including the California Governor’s Office of Emergency Services. Response activities are centered on two primary requests from the local emergency managers: damage assessment information on built infrastructure, and impacts of air quality and human health risks. The team will be posting maps and data products on its open-access mapping portal as new information becomes available.

NASA Earth Observatory images by Lauren Dauphin, using Landsat data from the U.S. Geological Survey. Story by Lindsey Doermann.

‍

‍

Tags:
Geotechnology
Climate Changes
about the author
Ronaldo Menezes

Ronaldo brings decades of expertise to the field of geotechnology. Now, he's sharing his vast knowledge through exclusive courses and in-depth e-books. Get ready to master spatial and statistical analysis techniques, and raise your professional level.

see all articles
featured content
Climate Changes
The Thermohaline Circulation and Climate Change
R
Five of the best software for working with geographic data, excluding GDAL, which is often used by many of them
Geographic Images
The five best places to find geographic data, with the rationale for each choice
Technology
The ten best groups to learn about geoprocessing, with the rationale for each choice
Geographic Images
Five of the best YouTube channels for learning and collecting geographic data, with a rationale for each choice
Geotechnologies
Geotechnology, Agribusiness and climate change
newsletter

Sign up for our Newsletter to receive content and tips on Geotechnology and R. 👇

Thank you! Your submission has been received!
Oops! Something went wrong while submitting the form.

Content you might also like

Climate Changes
Bahía Blanca Inundated
Intense rainfall triggered deadly flash flooding in Bahía Blanca, Argentina, in late austral summer 2025. The city received approximately 400 millimeters (15.7 inches) of rain in 8 hours on March 7, local authorities told news outlets—about two-thirds the average amount the area sees in one year.
Jul 16, 2025
Ronaldo Menezes
Climate Changes
Europe’s Early Summer Heatwave: A Geospatial Challenge
How GIS helped track, understand, and mitigate record heat in summer 2025
Jul 9, 2025
Ronaldo Menezes
Climate Changes
Storm duo churns over the pacific: Hurricanes barbara and cosme
As the 2025 eastern Pacific hurricane season progresses, two tropical cyclones Barbara and Cosme were actively churning off the western coast of Mexico. Captured in a stunning image by the VIIRS (Visible Infrared Imaging Radiometer Suite) aboard the NOAA-20 satellite on June 9, 2025, at 20:15 Universal Time, the storms presented a remarkable sight from space.
Jun 30, 2025
Ronaldo Menezes
Wildfire Maps Help Firefighters in Real Time
A NASA sensor recently brought a new approach to battling wildfire, providing real-time data that helped firefighters in the field contain a blaze in Alabama. Called AVIRIS-3 (Airborne Visible Infrared Imaging Spectrometer 3), the instrument detected a 120-acre fire on March 19 that had not yet been reported to officials.
Jun 23, 2025
Ronaldo Menezes
Climate Changes
Spring Flooding in Kazakhstan
For the second year in a row, northern Kazakhstan experienced significant flooding caused by rapid snowmelt combined with intense spring rains. In 2025, this natural phenomenon once again inundated riverside communities, displacing hundreds of residents and impacting livelihoods along the Esil River and other waterways.
May 29, 2025
Ronaldo Menezes
Geotechnologies
Unlocking Geospatial Power: Understanding Algorithm Providers in QGIS
QGIS has become a cornerstone of open-source geospatial analysis, offering a powerful and flexible environment for spatial data processing. At the heart of its analytical capabilities lies a hidden gem that many users overlook: Algorithm Providers.These providers serve as the engines behind QGIS’s geoprocessing tools, enabling users to perform everything from simple vector operations to advanced raster modeling—all from a single, unified interface. Understanding how these algorithm providers work—and how to access them—can drastically improve your workflow and unlock the full potential of QGIS.
May 9, 2025
Ronaldo Menezes
see all
Social media

Follow us on Instagram

@rmgeoeasy
contact

Contact us

Talk to us on WhatsApp

+351 919 428 158 >

Send us an E-mail

geoeasy0@gmail.com >

Follow our content

Go to Instagram >

homesolutionscontact
talk to us
© Copyright 2024 | Geoeasy Geotechnology
Carefully developed by Digital Bloom